
How to Calculate Return on Invested Capital
Summary of Michael Mauboussin's Article on Return on Invested Capital


Introduction
This article by Michael Mauboussin provides a good analysis to understand return on invested capital (ROIC) and it discusses how to properly calculate it.
ROIC, according to Investopedia, is a financial metric that assesses a company's efficiency in allocating capital to profitable investments. In other words, it helps determine whether a company is creating value with the investments it is making.
Michael Mauboussin’s article goes into:
· How ROIC is calculated.
· How it is connected to free cash flow, growth, and economic profit.
· Practical challenges, showing how to estimate ROIC properly.
· Empirical data.
· Showing how intangible investments can alter the ROIC calculation.
Here is a simple example to help understand ROIC and whether it creates value or not.
Assume a company invests $10,000 with an opportunity cost of 8%. If the company earns $500 of cash flow from that $10,000 investment, this results in a value of $6,250 ($500/.08). This is a poor investment and doesn’t create value since the net present value of $6,250 is less than the initial investment of $10,000.
Now assume that a company earns $800 in cash flow per year on that $10,000 initial investment. $800/.08 is equal to $10,000, so this is a value-neutral business. No value is being generated here, but no value is being lost either.
Now let’s assume that the company earns cash flow of $1,100. This produces value because $1,100/.08 is equal to $13,750, which exceeds the initial investment of $10,000. And if the company can keep growing, while sustaining these same returns on invested capital of 11% ($1,100/$10,000), it will create more value.
So, in summary, a company only creates value when the present value of cash flows from its investments exceeds the cost of the investments.
If ROIC Exceeds WACC Then Value is Being Created
If a company has invested successfully, as reflected in a positive spread between ROIC and WACC, then we would expect the market to value the enterprise value at a premium to the amount of invested capital.
If ROIC exceeds the weighted average cost of capital (WACC) then the market should typically apply a premium to the enterprise value versus its amount of invested capital. In other words, enterprise value should exceed total invested capital if ROIC exceeds WACC.
ROIC is defined as follows:

Net Operating Profit After Taxes (NOPAT)
Net operating profit after taxes (NOPAT) is the cash earnings that a company would have if the company had no excess cash or debt. NOPAT is a comparable metric for different companies because each company operates on a different capital structure.
In other words, some companies use more debt than other companies, but NOPAT adjusts for this because it adds back interest expense, which would differ for each company depending on how much debt they have.
NOPAT starts with operating income (EBIT) on the income statement, adds back amortization from acquired intangible assets and the interest component of the company’s operating lease expense.
Operating lease expense is added back because it is a financing cost, not an operating expense, and as mentioned earlier, we want to calculate the cash earnings of a company without penalizing it for its capital structure.
The reason why amortization from acquired intangible assets is added back is because of how the accounting for maintaining acquired intangible assets are treated on the income statement. If a company acquires a target company, who has a valuable customer list, that valuable customer list is an intangible asset, and the cost to maintain that customer list is going to be expensed on the income statement.
The acquired customer list will lose value over time, but the company will spend money to increase or maintain the value of this customer list. One way a company will do this is through the salaries and commissions paid to employees to maintain and grow client relationships.
Therefore, if the customer list is being amortized and the company is spending to maintain the initial value (or grow the value) of the customer list, then the cost is included twice – once for the amortization and once for salaries expense.
Keep in mind that this differs from tangible assets like machinery and equipment because the investment that a company makes to maintain or grow its tangible assets isn’t reflected in the income statement. It is reflected in capital expenditures on the cash flow statement instead. So, the treatment of maintaining acquired intangible assets differs from the treatment of acquired tangible assets when calculating NOPAT.
After adjusting EBIT for the amortization of acquired intangibles and for financing costs, the final adjustment to arrive at NOPAT is the adjustment for taxes. There are three parts to adjusting for taxes:
1. Tax provision
2. Deferred taxes
3. Tax shield
Tax Provision Adjustments: To estimate the taxes, it is best to start with what is shown on the income statement (see Exhibit A). Adjustments then need to be made for unusual items like restructuring charges.
For companies that spend a lot on R&D, adjustments may need to be made for R&D because the Tax Cuts and Jobs Act of 2017 requires the amortization of R&D over a five-year period instead of being expensed right away. An example that Michael Mauboussin used here was Northrop Grumman. Northrop estimated that it would pay an additional $1 billion of taxes in 2022 due to the change. This will lower net operating profit and ROIC because the company can’t deduct all its R&D spending in the current period. It must amortize this R&D over 5 years, so the deduction is lower than it would have been had the full expense been able to be deducted in the current period.
Exhibit A: Microsoft’s Income Statement

Source: Microsoft Filings
Deferred Taxes: Deferred taxes have a deferred tax asset component and a deferred tax liability component. Companies have two sets of books. They have a set of books for tax purposes and for financial reporting purposes. Differences in timing can create situations where cash taxes will be different than the actual tax expense reported on the income statement.
A common example of this is when the depreciation method differs between the books used for financial reporting purposes and for tax purposes. A company may use straight line depreciation for financial reporting and accelerated depreciation for tax purposes, creating a deferred tax asset or liability.
Even though there is a timing difference, the taxes must be paid eventually, which is why the difference gets reported as a deferred tax liability on the balance sheet. To adjust for this, you calculate the difference between the deferred tax liability from one year to the next. An increase in the deferred tax liability reduces cash taxes.
Michael Mauboussin says:
“One way to estimate deferred taxes is to calculate the year-to-year change in operating deferred tax liabilities minus deferred tax assets.”
Tax Shield: this component comes about because of the deduction for interest expense. Interest expense protects a company from having to pay some taxes because if the company is financed only with equity, net income would be higher than if it was financed with some debt.
This benefit is removed in the calculation of NOPAT when calculating ROIC, but it is reintroduced in the calculation of cost of capital. The tax shield is equal to net interest expense multiplied by the marginal tax rate.
Exhibits B and D shows an example of a NOPAT and invested capital calculation that Michael Mauboussin did for Microsoft. Notice that it started with EBIT directly from the income statement and then made the necessary adjustments for amortization of intangibles, operating lease payments, and taxes.
Exhibit B: Calculation of Microsoft’s NOPAT (2020-2022)

Source: Counterpoint Global, Microsoft
Invested Capital
The denominator in the equation is invested capital and can be calculated in two ways. Since accounting relies on double entry bookkeeping, invested capital can be calculated using the net assets or it can be calculated using the company’s debt and equity. Debt and equity are how a company finances its assets.
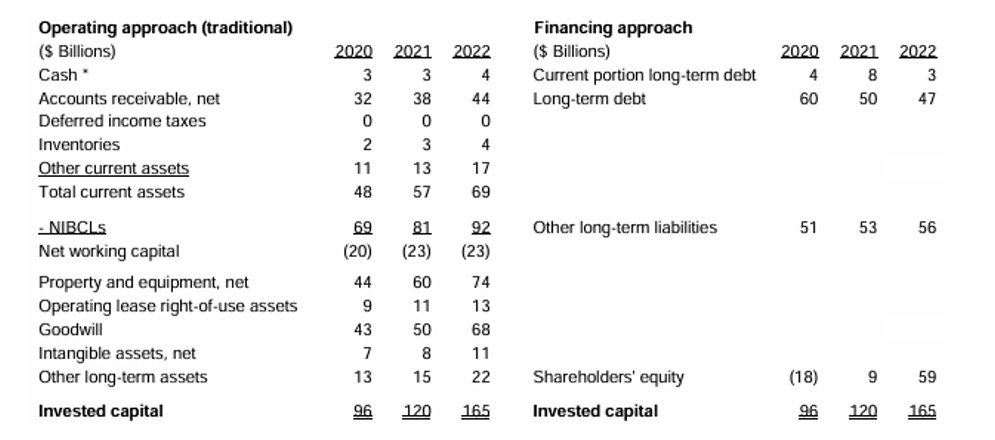
Exhibit C: Two Approaches to Calculate Invested Capital

Source: Counterpoint Global
Calculating Invested Capital Using the Operating Approach
Michael Mauboussin recommends using the operating approach to calculate invested capital so let’s start there.
To calculate invested capital using the operating approach (asset side of the balance sheet), start with net working capital. This includes all current assets on the balance sheet, of which accounts receivable and inventory are typically the largest components, but this excludes excess cash and marketable securities. Excess cash isn’t required to run the operations of a business, so this is why it isn’t included.
There are a couple reasons why a company may hold excess cash. One reason is for risk management purposes. If a company competes in a cyclical market, it may make sense to hold excess cash knowing the market faces steep declines on the back of falling demand.
Another reason could be because the company may want to be able to take advantage of opportunities in a steep downturn. If a market faces a steep decline, a company that holds excess cash is in a better position to acquire competitors or suppliers or distributors who are facing liquidity crunches because they were ill-prepared for the market downturn.
Non-interest-bearing current liabilities, of which accounts payable are typically the largest component, should be subtracted from current assets to arrive at net working capital. Keep in mind that current debt is an interest-bearing liability, so it shouldn’t be included.
Current Assets - Excess Cash and Marketable Securities = Net Current Assets
Current Liabilities - Non-interest-bearing Current Liabilities = Net Current Liabilities
Net Current Assets – Net current liabilities = Net Working Capital
Next, we include net property plant and equipment (PPE) and right of use assets. Internal-use software should be included in PPE. This is an intangible investment that is amortized over its useful life. Right of use assets are leases that are longer than 1 year.
Next, intangible assets like goodwill and acquired intangible assets are included. Goodwill is the excess price that was paid in an acquisition above the fair value of the tangible and identifiable intangible assets net of liabilities.
Intangible assets may include a customer list, brand name, and intellectual property like patents, trademarks or copyrights. These intangible assets, when acquired, represent a use of capital that is invested, so acquired intangible assets are included in invested capital and are crucial to understanding how a company is generating a return on its investments.
The last item that is included in invested capital under the operating (assets) approach is other long-term operating assets. To get a proper estimate of invested capital, all assets that a company needs to run a business need to be included.
With this said though, there are nonoperating assets that shouldn’t be included in invested capital. These assets include excess cash and marketable securities, non-consolidated subsidiaries, finance subsidiaries, equity investments in other companies, overfunded pension funds, and tax loss carryforwards.
Calculating Invested Capital Using the Financing Approach
In Exhibit D Michael calculates invested capital for Microsoft from 2020 to 2022 using both the financing approach and the operating approach. To calculate cash under the operating approach, he multiplied 2% times revenue. This adjusts for any excess cash that the company may have on its balance sheet.
His 2% is an estimate of what he believes is the percentage of revenue that Microsoft needs in cash to run its operations. Note that invested capital is the same whether it is calculated under the operating approach or the financing approach.
Exhibit D: Microsoft’s Invested Capital from 2020 to 2022
Source: Microsoft and Counterpoint Global
It would be nice if we were finished here but unfortunately there is more work that needs to be done, and this work requires lots of estimates.
Intangible Investments
Intangible investments have played a much larger role in valuation over the past few decades. Companies used to run their operations predominantly using tangible investments, which included assets like PPE and inventory.
Companies today rely much more heavily on intangible investments, and the way these investments are accounted for can make calculating return on invested capital tricky.
Take for example research and development (R&D). R&D is expensed, but some of this R&D may have future benefits. The reason accountants expense it is because the future benefit is uncertain and the link between R&D costs and revenue is unclear.
There is certainly some R&D expense that should be capitalized though, and this requires lots of estimates to properly calculate return on invested capital. So, the way to handle this is to capitalize intangible investments (from the income statement) and put them on the balance sheet and then amortize them over the useful life.
One area on the income statement to look for these intangible investments is the selling, general, and administrative (SG&A) expense line and the R&D expense line. Michael again uses Microsoft as example.
Exhibit E: Capitalization of Intangible Assets for Microsoft in 2022
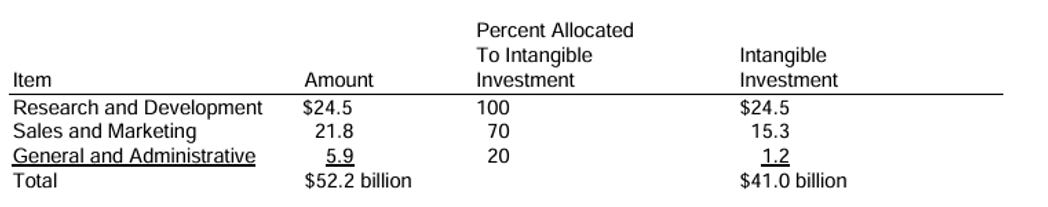
Source: Microsoft and Counterpoint Global
Microsoft spent a total of $52.2 billion on R&D, sales and marketing, and general and administrative. Michael estimates that 100% of R&D should be capitalized, in other words, all of R&D is an investment that will have a future benefit, 70% of sales and marketing expense should be capitalized, and 20% of general and administrative expenses should be capitalized.
This creates an intangible asset line on the balance sheet of $41 billion that should be amortized. It also removes $41 billion in expenses from the income statement, increasing net income, but it then creates an amortization expense line on the income statement, reducing net income.
The net result is higher NOPAT and higher invested capital. Asset light companies will have more adjustments than companies that rely heavily on tangible capital.
Hulten and Carol Corrrado did research that concluded that R&D should be amortized over six years, and sales and marketing and general and administrative expenses should be amortized over two years, so these are the useful lives that Michael used in his estimates.
The adjustments that Michael made for capitalizing intangible assets are shown below in Exhibit F and Exhibit G.
Exhibit F: Calculation of NOPAT With and Without Intangible Investment Adjustments
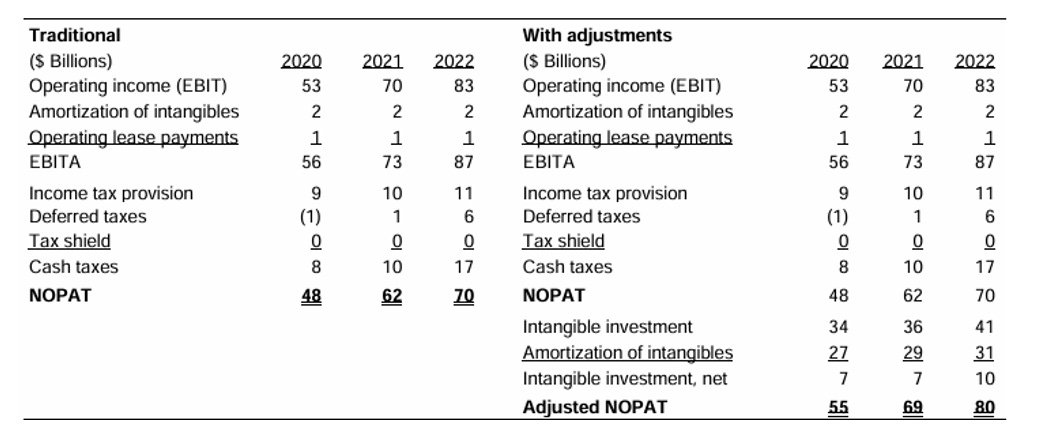
Source: Microsoft and Counterpoint Global
Exhibit G: Calculation of Invested Capital With and Without Intangible Investment Adjustments

Source: Microsoft and Counterpoint Global
For 2022, the adjustments increased NOPAT from $70 billion to $80 billion, increased invested capital from $165 billion to $260 billion, and decreased return on invested capital from 49% to 34%.
Exhibit H: ROIC With and Without Adjustments for Intangible Investments

Source: Counterpoint Global
Conclusion
Calculating return on invested capital can be an exhausting exercise when dealing with companies that have lots of intangible investments. It can even be an exhausting exercise, though much less so, when dealing with companies that have lots of tangible assets, but not many intangible investments.
Michael mentions that the payoffs of doing the work can be worth it because getting an idea of the true ROIC of a business provides better insight about how much profit and investments are being generated, which is helpful for investors who rely on multiples. Properly calculating ROIC also gives a better idea of how to compare companies across industries.
An example that can be used is the data warehouse company Snowflake. Snowflake reported a large GAAP loss in FY 2022, but some of the expenses on the income statement should arguably not all be expensed in the current year since the company is likely to get a future benefit from it.
Exhibit I shows the adjustments that Michael made for Snowflake. The adjustments result in an ROIC of 3% instead of an ROIC of -416%. This is a major change and shows the complexity that can happen for companies that are making lots of intangible investments. And notice also that return on invested capital of 3%, although not that good a of a return on invested capital, can be compared to peers much easier than a ROIC of -416%.
Exhibit I: Adjustments Made to Snowflake to Calculate ROIC

Source: Snowflake and Counterpoint Global
It is also good to keep in mind that the ROIC calculation shown here thus far is backwards looking. It calculates what the company is earning on ROIC in the past, but the market cares about what the company will be earning on its invested capital in the future.
To get an idea of this, Michael discusses return on incremental invested capital, as shown in Exhibit J.
Exhibit J: Calculation for Return on Incremental Invested Capital

Source: Counterpoint Global